Akamai Intros Internet Weather Map
Jun 7th, 2007 | By James Lewin | Category: Digital Music, General, Podcasting Networks, Podcasting Research, Podcasting Services 
Content delivery network Akamai Technologies unveiled today a new service that lets you interactively view real-time statistics on Internet traffic.
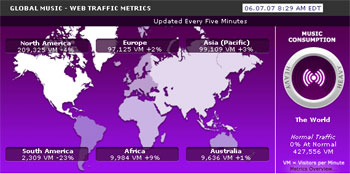
In addition to letting you view Latency, Traffic and Attacks for the Internet, the service provides net usage indexes for Music, News and Retail.
The information is captured by Akamai’s content delivery network. Akamai has over 25,000 servers in more than 750 cities around the world. According to Akamai, they deliver 20% of the world’s Internet traffic.
With its Visualize service, Akamai is providing a visual understanding of why some Web traffic may be slow, infected, or simply non-existent.
“Its easy to take for granted that the Internet will always be on, and always working,” said Tom Leighton, co-founder and chief scientist of Akamai. “Reality shows us that there are many factors, on any given day, degrading the Internet‚Äôs performance. Some are malicious, and some are the result of the incredible amount of content being requested at any one time. Akamai is in a unique position to monitor the Internet in real-time, identifying where and when the Internet is being taxed.”
Akamai is introducing three distinct data visualization tools, each with interactive settings, allowing visitors to customize the data based on interest. Continues Leighton, “Although there is a great deal more that we monitor daily on the Internet on behalf of our customers, these tools are a first for giving the public a view into the Internet’s growth, stability and potential trouble spots.”
Real-Time Web Monitor
Offering three modes of visualizing the Internet in real-time, the Real-Time Web Monitor identifies the global regions with the greatest attack traffic, cities with the slowest Web connections (latency), and geographic areas with the most Web traffic (traffic density).
Attack Traffic
Akamai displays real-time attack traffic by geo-region (state, province or country). This visualization is based on data collected that includes the number of connections that are attempted, the source IP address, the destination IP address and the source and destination ports. The packets captured are generally from automated scanning trojans and worms looking to infect new computers scanning randomly generated IP addresses.
Latency/Speed
Akamai measures network latency between most major cities via regularly automated tests. These tests consist of web connections and downloads, as well as Internet Control Message Protocol (ICMP) pings. Displayed in this interface are the current top ten worst performing cities. Absolute Latency depicts the current latency of a given city, while Relative Latency depicts the differential between the city’s current latency and its historical average latency.
[…] We love stats, even those of use who say we don’t – we’re all closet stats lovers especially when it comes to anything about the Internet. We watch our web traffic to scout out trends and we jealously view other sites stats to see how we can do better. Well we all just got a new real-time junkie feed today courtesy of Akamai Technologies. Which considering the fact that they delivery about 20% of the world’s chances are the data should be pretty good. [via PodcastingNews] […]
[…] We love stats, even those of use who say we don’t – we’re all closet stats lovers especially when it comes to anything about the Internet. We watch our web traffic to scout out trends and we jealously view other sites stats to see how we can do better. Well we all just got a new real-time junkie feed today courtesy of Akamai Technologies. Which considering the fact that they delivery about 20% of the world’s chances are the data should be pretty good. [via PodcastingNews] […]